
Benchmark Report
Audience: anyone checking the numbers. This page is the evidence behind the README’s performance claims: what was measured, how, on which devices, where the data lives, and how to reproduce it.
Source of truth
Section titled “Source of truth”Both libraries run in the same app, in the same Hermes instance, against the same inputs, in a Release build on a physical phone.
- Payload. The iPhone XS run, the run the README carries, is committed as
apps/example/benchmark.json. - Charts.
img/benchmark.svgandimg/benchmark-batch.svgare rendered from that payload bybun run benchmark:svg. - Second device. The Galaxy S23 run is a second measurement on a second device. The repository keeps one payload file, so its figures live in the results tables below rather than in a committed payload, and no chart is rendered from them.
- Run conditions. The device state in each provenance block is recorded from the device during the run, because the payload does not carry it.
Headline metric
Section titled “Headline metric”The README reports the largest measured speedup: compactCells at 862× on the iPhone XS.
This workload is intentionally included because it exposes the cost of crossing the JavaScript/Emscripten boundary with large cell sets.
Read that factor with its own median in mind. compactCells finishes in 0.085 ms on the iPhone XS,
at the resolution of the clock, so a jitter of a few hundredths of a millisecond moves the factor by
tens of percent: across the two iPhone XS runs on record it landed at 807× and 862×. polygonToCells
is the stable large factor. Its 220.7 ms median sits far above clock resolution, and the same two
runs put it at 337× and 341×.
Every figure on this page is workload- and device-dependent. These are representative measurements from the runs named above, not guaranteed speedups on another device or another workload.
The complete workload matrix is reported below.
Methodology
Section titled “Methodology”To ensure apples-to-apples comparisons, both libraries (react-native-nitro-h3 and h3-js) are
imported into the exact same Benchmark screen (apps/example/src/BenchmarkScreen.tsx). They run
inside the same app, the same Hermes instance, against the exact same inputs, just seconds apart.
Nothing is compared across different processes, machines, or days.
1. Execution Strictness
Section titled “1. Execution Strictness”- Release Builds Only: A Debug build slows the native side several times over, so its numbers
are not comparable. The screen reads
__DEV__and recordsDebugorReleasein the payload, andbun run benchmark:svgrefuses a Debug payload. - Detailed Telemetry: The payload records
measuredOnmetadata (platform, device model on Android, OS, React Native and Hermes versions, h3-js version, date, warm-up count, duration) written by the screen, not by hand.
2. The Measurement Loop
Section titled “2. The Measurement Loop”Each workload is timed using the following sequence:
- Warm-up: One untimed warm-up pass so neither library pays the initialisation cost of its first call.
- Timed Passes: 20 timed passes for most workloads. (Exceptions:
W3andW2dget three passes, as a singleh3-jsrun of either takes seconds;W0takes 1,000 passes of one call.) - Event Loop Yielding: Between samples, the thread yields to the event loop. This prevents the
app from freezing during minutes-long runs. The pause occurs strictly outside the timed windows.
(Exception:
W0yields every hundredth sample, because a macrotask costs more than the single call it would separate.) - Statistical Aggregation: The published figure is the median (the upper of the two middle
samples on an even count). The p95 (by nearest rank, the 19th sample out of 20), minimum, and
maximum are recorded beside it. A
W0sample is one call, so its median and p95 describe a single call rather than a pass.
3. Strict Equivalence Validation
Section titled “3. Strict Equivalence Validation”Speed means nothing if the answer is wrong. Result equivalence is checked outside the timed loop, from the warm-up value or a fresh untimed pass:
- Cells: Compared as sorted, lowercase hexadecimal strings (the only representation both libraries can be brought to without timing the conversion).
- Coordinates and Boundaries: Compared component by component with a tolerance of
1e-9degrees. - Order: Sorted for a set of cells, in order for
W10, where the path is the answer. - Batch Rows:
W11’s cells are compared withh3-js’s element by element in input order, andW12’s centres component by component within1e-9degrees. - Async Parity: The async
W3andW8rows have noh3-jscounterpart, so their output is validated against the synchronous result of the same workload.
Note: A run that fails validation is marked
RESULTS DIFFER FROM h3-jsin the screen’s caption and must not be published.
4. What Each Workload Covers
Section titled “4. What Each Workload Covers”The set is chosen so the headline rows can be read in context rather than alone:
W0is the map tap: one call per sample, where no batch hides the cost of a single crossing.W2atoW2dvarykover the same loop, so a factor can be read against the work one call does.W6andW7cycle the 1,261 cells of ak=20disk rather than one repeated cell.W8sizes its result withcellToChildrenSizebefore the run and targets the highest resolution that stays inside a 4,000,000 cell budget the benchmark sets for itself, so the row label names the resolution actually measured. On both runs below the target resolution 12 fits, at 410,914 cells.W11andW12have noh3-jscounterpart, so each is compared against 100,000 individualh3-jscalls doing the same work.
5. Chart Rules
Section titled “5. Chart Rules”- Paired Bars:
img/benchmark.svgshows the four headline workloads (W1,W3,W4andW7) as paired bars,react-native-nitro-h3aboveh3-js, each pair scaled linearly so theh3-jsbar spans the full width. The remaining workloads are in the tables below. - The Batch Chart:
img/benchmark-batch.svgis rendered from the same payload and puts one batch call against theh3-jsloop and against this package’s own per-call loop. ItsW1againstW11pair carries a footnote, because that pair is not input-matched; see The Batch Rows below. - Where the Headline Comes From:
bun run benchmark:svgprints the widest factor of a payload as aHEADLINEline; the screen reports rows and their per-row factors and nothing else. Which factor deserves a headline is a judgement made when the numbers are published, not by the app that measures them. - A Payload Keeps Its Factors: a payload whose rows carry a
factorfield is published with the factor the screen displayed, because recomputing one from medians rounded for the screen drifts from what was measured.
6. The Workload Ids
Section titled “6. The Workload Ids”| Id | Workload |
|---|---|
W0 |
latLngToCell, 1 call per sample, 1,000 samples |
W1 |
latLngToCell, 100,000 calls |
W2 |
gridDisk(k=20), 1,000 calls |
W2a to W2d |
gridDisk at k of 1, 5, 10 and 50, 1,000 calls each |
W3 |
polygonToCells, San Francisco at res 12, sync and async |
W4 |
compactCells, k=20 disk |
W5 |
cellsToMultiPolygon, k=20 disk |
W6 |
cellToLatLng, 100,000 calls |
W7 |
cellToBoundary, 100,000 calls |
W8 |
uncompactCells, San Francisco res 9 to res 12, sync and async |
W9 |
cellToChildren, res 5 to res 10 |
W10 |
gridPathCells, Berlin to Hamburg at res 9, 1,000 calls |
W11 |
latLngsToCells, 100,000 coordinate pairs in one call |
W12 |
cellsToLatLngs, 100,000 cells in one call |
Results
Section titled “Results”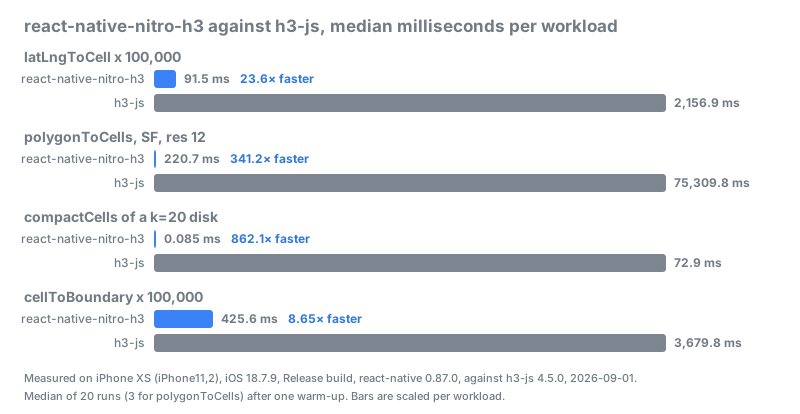
Both runs come from a physical phone in a Release build, driven end to end by
bun run benchmark:device. CI does not produce these figures: an emulator on a shared runner says
nothing about a phone. All timing figures represent the median execution time in milliseconds, and
the speedup factor is the h3-js median divided by the react-native-nitro-h3 median, computed from
the unrounded medians in the payload. Both devices ran the same code, built by
scripts/build-device-release.sh from main at 1d79ef7 plus the log mirror in
apps/example/ios/H3Example/AppDelegate.swift that the capture needs, which is outside the measured
code path. Both phones were on wired USB power for the whole run.
iPhone XS, iOS 18.7.9, 2026-09-01
Section titled “iPhone XS, iOS 18.7.9, 2026-09-01”| Field | Value |
|---|---|
| Device | iPhone XS (iPhone11,2), Apple A12 Bionic, 2018, 4 GB RAM |
| Platform | iOS 18.7.9 (build 22H355) |
| Build Type | Release |
| React Native | 0.87.0, Hermes 250829098.0.16 |
| Target | h3-js 4.5.0 (the same H3 v4.5.0 C core this package vendors) |
| Capture | bun run benchmark:device; the payload is committed as apps/example/benchmark.json |
| Duration | 1,213 seconds |
| Passes | 1 warm-up pass, then 20 timed runs per workload (3 for the two W3 rows and W2d, 1,000 single calls for W0) |
| Power | wired USB throughout, and therefore charging, with the screen on and the Benchmark tab in the foreground |
| Thermal | not recorded: iOS 18.7.9 exposes neither battery level nor thermal state to the host |
| Equivalence | 19 of 19 rows |
| Workload | react-native-nitro-h3 | h3-js | Speedup | Eq. | Detail |
|---|---|---|---|---|---|
W0: latLngToCell (per call) |
0.0042 ms | 0.046 ms | 10.9× | ✅ | 1,000 distinct inputs, 0.0002 ms baseline subtracted, p95 0.0063 ms against 0.048 ms |
W1: latLngToCell (100k) |
91.5 ms | 2,156.9 ms | 23.6× | ✅ | Returns 89283082803ffff |
W2: gridDisk(k=20) (1,000×) |
27.7 ms | 4,907.5 ms | 176.9× | ✅ | 1,261 cells per call |
W2a: gridDisk(k=1) (1,000×) |
2.4 ms | 30.0 ms | 12.5× | ✅ | 7 cells per call |
W2b: gridDisk(k=5) (1,000×) |
3.9 ms | 363.1 ms | 92.6× | ✅ | 91 cells per call |
W2c: gridDisk(k=10) (1,000×) |
8.6 ms | 1,352.4 ms | 157.6× | ✅ | 331 cells per call |
W2d: gridDisk(k=50) (1,000×) |
174.7 ms | 31,924.9 ms | 182.8× | ✅ | 7,651 cells per call |
W3: polygonToCells (SF, res 12) |
220.7 ms | 75,309.8 ms | 341.2× | ✅ | 412,377 cells |
W3: polygonToCellsAsync (SF, res 12) |
214.5 ms | n/a | n/a | ✅ | 412,377 cells |
W4: compactCells (k=20 disk) |
0.085 ms | 72.9 ms | 862.1× | ✅ | 1,261 cells in, 163 cells out |
W5: cellsToMultiPolygon (k=20 disk) |
2.0 ms | 374.0 ms | 187.5× | ✅ | 1 polygon |
W6: cellToLatLng (100k) |
112.0 ms | 1,303.1 ms | 11.6× | ✅ | Over 1,261 distinct cells |
W7: cellToBoundary (100k) |
425.6 ms | 3,679.8 ms | 8.6× | ✅ | Over 1,261 distinct cells |
W8: uncompactCells (SF res 9 to res 12) |
3.9 ms | 1,234.3 ms | 320.4× | ✅ | 190 cells in, 410,914 cells out |
W8: uncompactCellsAsync (SF res 9 to res 12) |
4.1 ms | n/a | n/a | ✅ | 190 cells in, 410,914 cells out |
W9: cellToChildren (res 5 to res 10) |
0.213 ms | 48.2 ms | 226.4× | ✅ | 16,807 children of 85283083fffffff |
W10: gridPathCells (Berlin to Hamburg, res 9, 1,000×) |
298.4 ms | 16,279.5 ms | 54.6× | ✅ | 914 cells per path |
W11: latLngsToCells (100k pairs) |
53.9 ms | 2,514.7 ms | 46.6× | ✅ | 100,000 pairs in one call against 100,000 h3-js calls |
W12: cellsToLatLngs (100k cells) |
23.3 ms | 1,315.3 ms | 56.3× | ✅ | 100,000 cells in one call against 100,000 h3-js calls |
Data provenance. The figures above come from the captured payload, apps/example/benchmark.json,
which bun run benchmark:device assembled from the app’s log while the run was still on screen. The
payload stores the unrounded median, p95, minimum and maximum of every row. The table rounds the
medians for display, one decimal above a millisecond and three below, and the Speedup column is
computed from the unrounded medians, so it can differ in the last digit from a factor recomputed
from the rounded figures shown here.
Samsung Galaxy S23, Android 16, 2026-09-01
Section titled “Samsung Galaxy S23, Android 16, 2026-09-01”| Field | Value |
|---|---|
| Device | Samsung Galaxy S23 (SM-S911U1), Qualcomm kalama |
| Platform | Android 16, API 36 (the payload’s osVersion field carries the API level) |
| Run date | 2026-09-01, about 22:20 to 22:30 CEST |
| Build Type | Release |
| React Native | 0.87.0, Hermes 250829098.0.16 |
| Target | h3-js 4.5.0 (the same H3 v4.5.0 C core this package vendors) |
| Capture | bun run benchmark:device; the payload is kept outside the repository, see Source of truth above |
| Duration | 608.4 seconds |
| Passes | 1 warm-up pass, then 20 timed runs per workload (3 for the two W3 rows and W2d, 1,000 single calls for W0) |
| Power | wired USB throughout, and therefore charging, with the screen kept on and the Benchmark tab in the foreground |
| Thermal | not recorded: the capture keeps every other device command off the phone while the run is timed |
| Equivalence | 19 of 19 rows |
| Workload | react-native-nitro-h3 | h3-js | Speedup | p95 (RN) | p95 (JS) | Eq. | Detail |
|---|---|---|---|---|---|---|---|
W0: latLngToCell (per call) |
0.0027 ms | 0.021 ms | 7.9× | 0.0039 ms | 0.035 ms | ✅ | 1,000 distinct inputs, 0.0002 ms baseline subtracted |
W1: latLngToCell (100k) |
76.1 ms | 930.7 ms | 12.2× | 76.3 ms | 940.4 ms | ✅ | Returns 89283082803ffff |
W2: gridDisk(k=20) (1,000×) |
19.9 ms | 2,299.4 ms | 115.4× | 25.3 ms | 2,303.1 ms | ✅ | 1,261 cells per call |
W2a: gridDisk(k=1) (1,000×) |
3.0 ms | 18.9 ms | 6.2× | 5.8 ms | 26.2 ms | ✅ | 7 cells per call |
W2b: gridDisk(k=5) (1,000×) |
3.4 ms | 164.4 ms | 48.7× | 5.1 ms | 164.9 ms | ✅ | 91 cells per call |
W2c: gridDisk(k=10) (1,000×) |
10.4 ms | 591.7 ms | 57.1× | 21.0 ms | 595.5 ms | ✅ | 331 cells per call |
W2d: gridDisk(k=50) (1,000×) |
108.9 ms | 14,394.9 ms | 132.2× | 108.9 ms | 14,498.8 ms | ✅ | 7,651 cells per call |
W3: polygonToCells (SF, res 12) |
178.5 ms | 29,671.7 ms | 166.2× | 181.7 ms | 32,143.5 ms | ✅ | 412,377 cells |
W3: polygonToCellsAsync (SF, res 12) |
275.1 ms | n/a | n/a | 290.0 ms | n/a | ✅ | 412,377 cells |
W4: compactCells (k=20 disk) |
0.110 ms | 35.2 ms | 321.4× | 0.202 ms | 36.2 ms | ✅ | 1,261 cells in, 163 cells out |
W5: cellsToMultiPolygon (k=20 disk) |
2.1 ms | 183.5 ms | 87.4× | 2.4 ms | 187.5 ms | ✅ | 1 polygon |
W6: cellToLatLng (100k) |
129.1 ms | 786.9 ms | 6.1× | 130.2 ms | 842.0 ms | ✅ | Over 1,261 distinct cells |
W7: cellToBoundary (100k) |
418.9 ms | 2,420.8 ms | 5.8× | 432.8 ms | 2,464.6 ms | ✅ | Over 1,261 distinct cells |
W8: uncompactCells (SF res 9 to res 12) |
4.3 ms | 900.1 ms | 211.7× | 5.6 ms | 954.5 ms | ✅ | 190 cells in, 410,914 cells out |
W8: uncompactCellsAsync (SF res 9 to res 12) |
4.9 ms | n/a | n/a | 7.8 ms | n/a | ✅ | 190 cells in, 410,914 cells out |
W9: cellToChildren (res 5 to res 10) |
0.218 ms | 36.2 ms | 165.7× | 0.315 ms | 37.3 ms | ✅ | 16,807 children of 85283083fffffff |
W10: gridPathCells (Berlin to Hamburg, res 9, 1,000×) |
248.4 ms | 8,267.6 ms | 33.3× | 263.4 ms | 8,816.9 ms | ✅ | 914 cells per path |
W11: latLngsToCells (100k pairs) |
48.6 ms | 1,384.4 ms | 28.5× | 54.2 ms | 1,397.6 ms | ✅ | 100,000 pairs in one call against 100,000 h3-js calls |
W12: cellsToLatLngs (100k cells) |
24.9 ms | 800.8 ms | 32.1× | 26.2 ms | 806.0 ms | ✅ | 100,000 cells in one call against 100,000 h3-js calls |
Rows Under 10 Milliseconds:
W0,W2atoW2c,W4,W5,W8andW9finish in under ten milliseconds on the native side, and each device figure is a single run. Repeating a run on the same device with the same build moved the factors of those rows by up to about half: the Galaxy S23’scompactCellsfactor moved from 205.9× to 321.4× between two runs on an own-side change of 0.028 ms. The rows in the hundreds of milliseconds moved considerably less. Read a factor as an order of magnitude, not as a constant.
The First Workload:
W0runs first and times a single call rather than a pass, so both of its medians are measured on a phone that has just come out of idle.
The Cost of a Thread Hop:
polygonToCellsAsynchas noh3-jscounterpart.h3-jsdoes not offer async variants, and timing its synchronous call as if it were async would skew the comparison. Instead, this row documents the cost of offloading work to a background thread. On the iPhone XS that cost is inside the noise: the asyncW3call came in at 214.5 ms against 220.7 ms for the synchronous one, andW8at 4.1 ms against 3.9 ms. On the Galaxy S23 it is about 97 ms on the 178.5 msW3call and 0.7 ms on the 4.3 msW8call.
The Batch Rows
Section titled “The Batch Rows”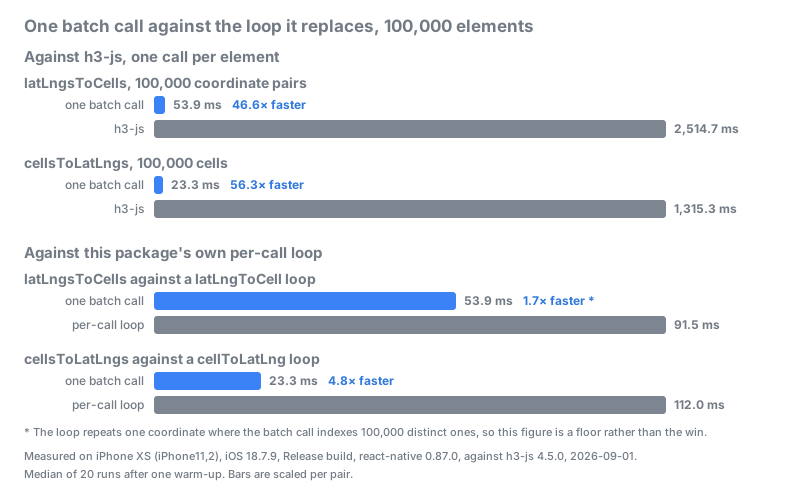
W11 and W12 answer a different question from the rest of the table. The comparison that matters
for a batch call is not its h3-js factor but the batch against this package’s own per-call loop,
over the same amount of work in the same run.
| Operation | per-call loop | one batch call | batch wins |
|---|---|---|---|
| coordinate to cell, 100,000, iPhone XS | W1 91.5 ms |
W11 53.9 ms |
1.70× |
| cell to centre, 100,000, iPhone XS | W6 112.0 ms |
W12 23.3 ms |
4.80× |
| coordinate to cell, 100,000, Galaxy S23 | W1 76.1 ms |
W11 48.6 ms |
1.57× |
| cell to centre, 100,000, Galaxy S23 | W6 129.1 ms |
W12 24.9 ms |
5.18× |
Read the two pairs differently, because only one of them is input-matched:
W6againstW12is a clean pair. Theh3-jssides bracket each other closely on both devices, 1,303.1 ms against 1,315.3 ms on the iPhone XS and 786.9 ms against 800.8 ms on the Galaxy S23, which is the evidence that the two workloads are comparable despiteW6cycling 1,261 distinct cells whereW12uses 100,000.W1againstW11is not, and its figure is a floor.W1repeats one coordinate 100,000 times whereW11uses 100,000 distinct ones, so the batch call does the harder work. Theh3-jssides show it: 17 % apart on the iPhone XS, 49 % apart on the Galaxy S23. Quote 1.70× as a lower bound, never as the win. AW1variant fed the same 100,000 distinct coordinates is the clean way to get the real figure, and that variant does not exist yet.- The saving is bridge crossings, not a faster inner loop. Host measurements put the native work of a batch call within about 2 % of the native work of the loop it replaces, so what the batch removes is the per-element crossing: roughly 0.38 and 0.89 microseconds per element on the A12, 0.28 and 1.04 on the Galaxy S23.
cellsToLatLngswins more thanlatLngsToCellson both devices, because its scalar sibling returns a fresh coordinate object per call, which is the expensive crossing, where the batch returns oneFloat64Array.- 100,000 elements is a favourable size by construction. Below a few hundred, one crossing plus
a typed-array allocation is a larger share of the total, and that crossover is unmeasured.
Building the input
Float64Arrayis not timed on either side either, so a caller who assembles one from JavaScript objects pays for that on top.
The Size Ledger
Section titled “The Size Ledger”Replacing h3-js trades JavaScript for machine code. Measured on 2026-08-30 from apps/example
with React Native 0.87.0, Hermes 250829098.0.16, h3-js 4.5.0 and react-native-nitro-h3 0.1.0:
| Item | Size |
|---|---|
Hermes bytecode dropped with h3-js |
271 kB |
Hermes bytecode added by the react-native-nitro-h3 JavaScript side |
39 kB |
libNitroH3.so, arm64-v8a |
794 kB |
libNitroH3.so, armeabi-v7a |
583 kB |
libNitroH3.so, x86_64 |
813 kB |
libNitroH3.so, x86 |
829 kB |
The bytecode figures come from two Metro bundles of the example app that differ only in whether
apps/example/src/BenchmarkScreen.tsx imports h3-js, each compiled with hermesc -O -emit-binary -output-source-map (React Native’s own production flags). The native figures are the stored sizes
in apps/example/android/app/build/outputs/apk/release/app-release.apk, of which 333 kB on
arm64-v8a is executable code and the rest is read-only data, symbol tables and C++ unwind
information. An Android App Bundle ships one ABI per device, so a phone pays one of those rows, not
four; an app with no other Nitro module also carries libNitroModules.so from
react-native-nitro-modules (980 kB on arm64-v8a). iOS was not measured.
The Cost of Unbounded Requests (What the Cell Ceiling Guards)
Section titled “The Cost of Unbounded Requests (What the Cell Ceiling Guards)”Neither library caps a request by default. h3-js bounds only its own Emscripten heap at 2 GB,
building JavaScript arrays of hexadecimal strings on top of it without a bound, and it offers
no setting to change that. react-native-nitro-h3 allocates whatever is asked for too, until
configure({ maxCellCount }) sets a Cell Ceiling; from then on an oversized request is refused
before anything is allocated.
To show what an unbounded request costs, the numbers below come from hardware far larger than a
phone (Apple M5 Pro, 24 GB RAM, macOS 26.5.2, bun 1.3.14, from
latLngToCell(37.7749, -122.4194, 9), measured 2026-08-28):
| Call | Cells | Packed Size | Wall Clock |
|---|---|---|---|
gridDisk(cell, 2000) |
12,006,001 | 96 MB | 1.14 s |
gridDisk(cell, 4000) |
48,012,001 | 384 MB | 6.16 s |
Context: “Packed size” is the memory footprint if those cells were stored as 64-bit integers
(8 bytes each). As an array of hexadecimal strings in h3-js they cost considerably more, which is
where the wall-clock time is largely spent. gridDisk(cell, 8000) (192,024,001 cells) was not run:
the array of strings it builds forces even an M5 Pro into swap.
The Mobile Reality: A phone has neither that memory nor those seconds to spare, and the allocation happens inside the app’s own heap. When it fails, the OS kills the process; no JavaScript
try/catchsees it. That is exactly what a Cell Ceiling guards against:react-native-nitro-h3sizes every result up front, so a ceiling can refuse the request with a catchableH3Error.
Regenerating the Benchmarks
Section titled “Regenerating the Benchmarks”To reproduce these numbers yourself, on a physical phone in a Release build:
1. Build and Install
Section titled “1. Build and Install”scripts/build-device-release.sh builds the example app in Release and installs it on the device
you name. On iOS it signs with the team you export, because the tracked project file carries none.
H3_IOS_TEAM_ID=ABCDE12345 scripts/build-device-release.sh ios <device-udid>scripts/build-device-release.sh android <adb-serial>2. Capture the Payload
Section titled “2. Capture the Payload”bun run benchmark:device drives the run and writes the payload the screen logs. It needs the
agent-device CLI on the path, and on a physical iOS device the three runner variables the
reference .mcp.json carries: AGENT_DEVICE_IOS_TEAM_ID, AGENT_DEVICE_IOS_RUNNER_APP_BUNDLE_ID
and AGENT_DEVICE_IOS_RUNNER_TEST_BUNDLE_ID.
The same three variables have to be in the environment of the agent-device background daemon. The
first agent-device call of a session spawns that daemon and it outlives the call, so a daemon
started without them builds the runner with ids this team cannot sign. The script refuses to start
in that case and names the process to stop.
bun run benchmark:device --platform ios --udid <device-udid> --out run.jsonbun run benchmark:device --platform android --serial <adb-serial> --out run.jsonThe script opens the app in its own automation session, starts log capture, presses Benchmark
and then Run benchmark, and waits for the payload to appear in the captured log. It writes
run.json and the raw log beside it as run.device.log, then prints the row count, the equivalence
count, the duration and the widest factor. --timeout-minutes defaults to 45, against about ten
minutes for a Galaxy S23 run and about twenty for an iPhone XS.
Two rules the script exists to enforce, because breaking either costs the whole run:
- The automation runner is installed and log capture is started before the first tap. On a
physical iOS device, starting capture relaunches the app through
devicectl --console, which reads stdout and stderr only;apps/example/ios/H3Example/AppDelegate.swiftmirrors every React Native log line to stderr so the payload reaches the host at all. - Nothing relaunches the app after a run. The results live only in the screen’s React state, so
a relaunch discards them. On a timeout or an error the script saves a screenshot beside
--outand exits non-zero, leaving the app exactly as it stands.
3. Render the Charts
Section titled “3. Render the Charts”Review the run, then copy it to apps/example/benchmark.json and render:
cp run.json apps/example/benchmark.jsonbun run benchmark:svgThe script validates the JSON (and refuses a Debug payload), renders both charts
(img/benchmark.svg and img/benchmark-batch.svg), and prints the widest factor of the payload as a
HEADLINE line. bun run benchmark:device refuses to write apps/example/benchmark.json unless
--publish is passed, so an unreviewed run cannot overwrite the published payload by accident.
Then run bun install and bun run og in website/ and commit the two PNGs it writes under
website/public/; the social preview of the site’s landing page is a raster copy of
img/benchmark.svg.
4. Publish
Section titled “4. Publish”Put that factor in the README’s Performance section, beside the device and the date, and update the methodology note from the new JSON. Update this document’s results table for that device, and its provenance block from the conditions recorded during the run.
If the payload could not be recovered and the figures come off the screen instead, say so in the
provenance block, set the payload’s source field, and give each row the factor the screen showed
rather than one recomputed from the rounded medians.
Pre-Flight Check: Before publishing, check the caption. If it says
Debugor carries aRESULTS DIFFER FROM h3-jswarning, the run is compromised and must not be published.
Extracting a Payload by Hand
Section titled “Extracting a Payload by Hand”When the automation is unavailable and the run is driven by hand, the payload still has to come out of a log. The screen prints a Markdown table, then the caption, then the payload itself.
Because the iOS unified log truncates a message at about a kilobyte, the payload is chunked into lines of the form:
BENCHMARK_JSON <i>/<total> |<chunk>|The chunking does not depend on the platform, so an Android run prints the same lines to logcat.
The | bars pin both edges of each chunk, because the log trims outer whitespace. Take the text
between the bars, in numerical order, concatenate it with nothing in between, and save the result
pretty-printed with 2 spaces.
Start the log capture before the run on either platform, and never relaunch the app to reach a log afterwards: the results live only in the screen’s own state, and a relaunch discards them. A run whose payload is lost that way has to be repeated.